You have read about people becoming multimillionaires investing Rs 50000 to Rs 100,000 investing in the stock market and are under the impression that diving inside the stock market is a sure-shot way to become rich. Is that true? Is that the norm or an aberration?
Hold your breath.
Only 5% to 10% of people make money in the stock market. So, maybe, one out of every ten people makes money in trading. Nine out of ten people lose their hard-earned money.
So who is making the money here?
This is the best-kept secret. Big investors, otherwise, known as wholesale buyers run the market. How does this happen? Like everything that involves money supply and demand runs the stock market. If the supply is more and demand is less, the price comes down. If the demand is more and the supply is less, the price goes up. The wholesalers buy huge chunks of a stock over a period of time increasing the demand and the retailers jump in. The end result is that the price of stock shoots up. How does the price of stock come down? The process is reversed. The wholesalers sell huge chunks of a stock over a period of time increasing the supply and the price comes down.
TV, print, and other news outlets are hand in hand with the wholesalers. Remember this the next time when you see your favorite financial expert go on and on about a stock.
It is also true that there are retail traders who are making a regular stream of income trading in the market. How do they do it?
The Two Ways of Approaching the Stock Market
1. Fundamental Analysis: This is a method of assessing the intrinsic value of a stock. Many factors come into play when doing fundamental analysis. Going through the financial statements, industry trends, political environment, competitor analysis, etc. Institutional investors wherewithal to undertake this exhaustive kind of analysis. It would be safe to assume for most retailers fundamental analysis would be a tough go.
2. Technical Analysis: This is a trading discipline used to evaluate investments and identify trading opportunities by analyzing statistical trends gathered from trading activity such as price movement and volume.
Assume you dealing with a livestock commodity. Fundamental analysis would include analyzing the breed, demand, supply, inventory cost of feed, mortality, etc. The fundamentals of agricultural commodities will be different. The beauty of technical analysis is that the concept will remain the same irrespective of the commodity that is being analyzed.
The Three Pillars of Technical Analysis
1. Market action discounts everything: This assumption tells us that all known and unknown information in the public domain is reflected in the latest stock price.
2. Prices move in trends: The concept of trend is the foundation of technical analysis. Once the trend is established the price moves in the direction of the established trend.
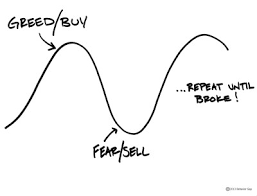
3. History repeats itself: The price trends tend to repeat itself. This is because the market participants react to price movements in a similar way. The base human emotions of fear and greed ensure that the price history repeats itself.
There are several types of technical analysis methods. What I am about to teach with my blog is called the Japanese Candlesticks.
What is a Candle Chart?
Candle charts originated in Japan in the 1700s by man named Munehisa Homma who found that there was a link between price and the supply and demand of rice and the markets deeply influenced the emotions of traders which are fear and greed.
Candlestick shows the emotions by visually representing the price moves in different colors. Traders use candlesticks to make trading decisions based on regularly occurring patterns that help forecast the short-term direction of the price.
The Basics of Candlestick Trading
Trading is simply a psychological game of fear and greed. Fear and greed are what manipulate supply and demand.
Fear leads to panic selling which creates supply in the market while greed leads to exuberant buying which creates demand.
It is impossible to master fear and greed. Successful traders have made a system and trade according to the rules of the system and execute their trades. This is where candlesticks come into play. Candlesticks help the traders by showing the traders subtle hints of the market.
How to Read a Candle Chart?
The price of a stock is an important chart component. Thousands of trades happen during the 6.15 hours of the market session in our stock market. There are multiples trades of the individual stock happening in a minute. The end result is that the price of the stock fluctuates throughout the course of the market hours. For traders, we need to track four price points. These are open, high, low, and closing price (OHCL).
Open: The first price at which a trade is executed.
High: Highest price at which the stock got traded.
Low: Lowest price at which the stock got traded.
Closing price: Final price of the stock at the time when the market closes. The closing price shows the market sentiment and serves as a reference for the next day’s trading.
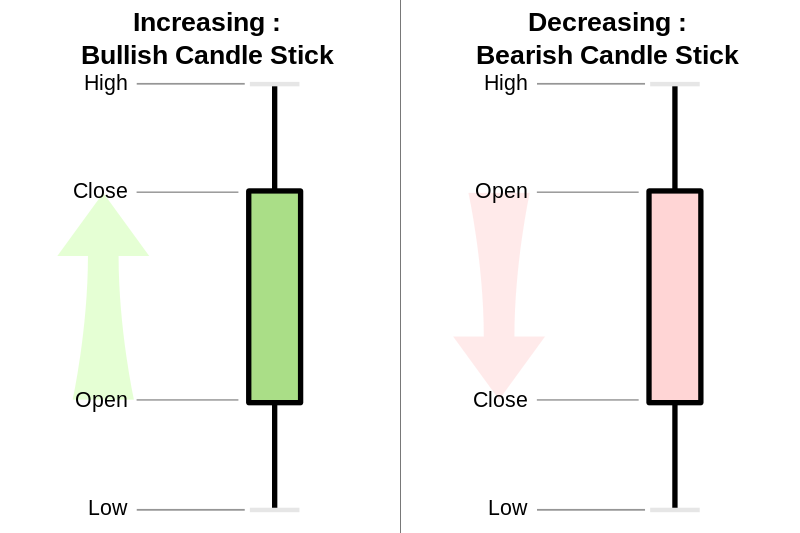
Let us look at the candle now. A candle has two components;
1. The body: It is the part between the open and close. When the opening price is lower than the closing price the color of the body is green which is also known as a bullish candle. When the opening price is higher than the closing price the color of the body is pink (as per the figure above) which is also known as a bullish candle.
2. The shadows or tails: The upper tail is the line above the body and the lower tail is the line below the body. In a bullish candle, the upper tail is between the closing price and the high price of the day, and the lower tail is between the opening price and the low price of the day. In a bearish candle, the upper tail is from the open trice to the high price of the day and the lower tail is from the closing price to the low price of the day.
As an exercise try plotting the OHLC of the stocks you like on a notebook. Check whether it is a bullish or a bearish candle. This is super important to understand candlestick trading patterns and make money day trading.
My next blog will be about types of candlesticks.
Please subscribe if you found this article useful.
This idea for the blog and the article was a result of the mentorship program from DigitalDeepak.com
Digital Marketing Specialist role according to Linkedin is among the top 10 most in-demand jobs
Recent Comments